In a recent NYT article entitled “Americans Are Finally Saving. How Did That Happen?” Ron Lieber wrote:
This was the year of the return to financial sobriety — if you judge such things by the nation’s personal savings rate
Most other journalists and economists have take the same position–that Americans have reacted to the recession by saving more.
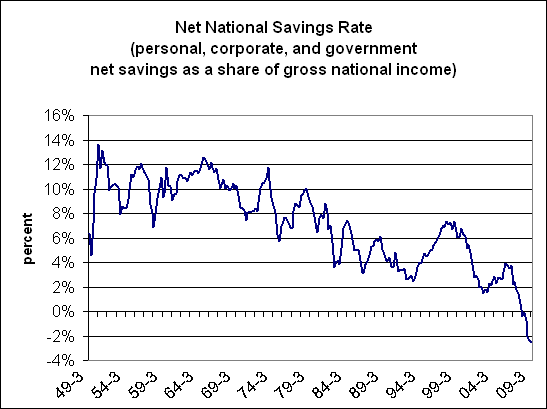
But for the U.S. economy as a whole, the savings rate has not gone up–it’s actually fallen .
What we see here is that the net national savings–the sum of personal, corporate, and government savings, net of depreciation–has been plunging rather than rising . The net national savings rate fell to -2.5% in the third quarter of 2009, its lowest level since the Great Depression. That’s astounding low.
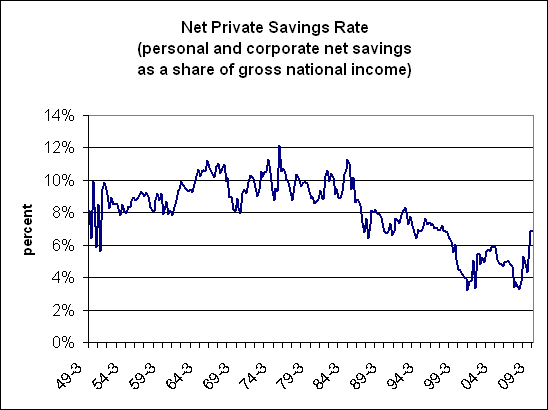
What’s going on here? As this chart shows, savings in the private sector has been on the rise, including both household and corporate savings, as most people believe.
But the government is running such big deficits that they swamp the savings gains in the private sectors.
Here’s another way of putting it: The government is borrowing a lot of money and transferring it to the private sector, through fiscal and monetary stimulus. The private sector is using some of those transfers to boost savings. But on net, the country’s savings rate as a whole is falling.
No financial sobriety here.
Note: These charts use savings net of depreciation. The same analysis holds using gross savings. Also, for the purposes of these charts, I have ignored the various adjustments to the official savings rate that I have made in previous articles.
Edited 1/5/10: Slight changes to chart language to clarify calculation.


Wouldn’t the classical interpretation of these charts be that nobody ever really believed that inflation has been conquered once and for all?
Mike,
Very interesting data. Could you provide us with your interpretation of what this means for real production, long-term investment, and inflation?
Thanks for all the great analysis!
David
S=Y-(C+T) and Y=C+G+I+NX imply that S+(T-G)=I+NX. In other words, national savings is equal to investment plus trade surplus. Overall, investment is relatively stable over time– there is no discernible trend in the investment share of GDP since 1949. On the other hand, net exports have fallen at an average rate of one percentage point of GDP every decade (though that almost entirely since the mid-1970’s.
What we are actually seeing in the first chart is the worsening of the balance of trade, which is a function of the exchange rate (i.e., the overvaluation of the dollar)
Given investment and net exports, it’s a matter of accounting that a worsening government fiscal position implies an improvement in private savings. Nothing here is a surprise.
Thanks for the information. It’s interesting to compare the savings rate to the changes in net national debt. According to this chart:
net national debt stopped increasing during the 3rd quarter of 2008 and may even be decreasing. While gov’t debt has increased sharply in this past year, nonfinancial and household debt have started to shrink. And there has been a marked decrease in financial debt.
So while the savings rate is negative, net national debt is also decreasing. I imagine this contradiction results from the net national debt including financial instruments, many of which were written off in the last year.
Is there a way to consider write-offs in conjunction with the savings rate?
Kosta,
The data in the chart is /not/ net debt, but rather gross. Hence there is no contradiction.
Could you tell me/us where to find this data? I couldn’t find it at Federal Reserve statistics- not where I looked anyhow. Thanks for posting this.
It seems to me we are in deeper trouble than …we are already in. Is this right? How would this impact inflation rates in the coming years?
You know what? The greater part of this industry makes its bucks selling overpriced services. No wonder people get confused.
Richard Florida is great to follow on twitter. He writes some interesting verse, he’s always good to keep up to date with and will often point you in the direction of some very good articles.
Nice interpretation. i agree that you need to support it with more data.
Investment in national savings schemes saw a big jump during January thanks to increase in interest rates on different products effected by the government in December.
“~, I am really thankful to this topic because it really gives useful information -,’